Introduction
Turbidity in liquids is caused by small suspended (undissolved) particles having a different refractive index than the surrounding medium. This interference results in reflection, absorption and scattering, i.e. a directional change of the irradiated light. With increasing particle concentrations the intensity of the scattered light is increasing and reaching a maximum which is influenced by the wavelength of the light, size and form of the particles, the refractive index and the color of the solution. The two most important factors influencing the intensity and the spatial distribution of the scattered light are the wavelength of the light and the size of the particles. In most biological applications the size of the particles is within a high nanometer- (100 - 500 nm, colloids) to a mid-micrometer range (0.5 - 5 μm cells). The wavelengths applied in turbidity measurements are usually in the near infrared range (NIR 700-1000 nm) to eliminate the influence of any colored substances. Since, especially for bigger particles, the angular intensity distribution of the scattered light around a particle is not symmetrical [1] (Fig 1.), the angle between the emission light beam and the detector is of critical importance when measuring turbidity. Besides measuring scatter at defined angles, also the absorption of the light can be used to measure turbidity. With the exception of back-scatter, scatter measurements are ideally suited to monitor very low turbidity values whereas the absorption or back-scatter approach can be used to measure extremely high turbidity values (Fig. 2).
Measuring Scatter – Angular Dependence
Turbidity measurements using a detection angle of 90° (side scatter) are most sensitive to particles in the size range of 0.1-0.5 μm [2] e.g., colloids, which is why this approach is described and commonly used for quality measurements in beer and drinking water.
For measurements of particles in the range of 0.5 - 5 μm however, lower angles, measuring the intensive forward scatter caused by bigger particles, are more appropriate. Theoretically the highest signal to background ratio or highest sensitivity is obtained when measuring as close to 0° as possible. Due to technical limitations given by the need for separating the scatter- from the transmission signal of the excitation beam, the lowest angle that can be realized is 11°. At lower angles the influence of the transmission signal with its negative slope caused by increasing absorption, becomes too big. Figure 3 representing measurements using formazin, a common turbidity standard with a particle size distribution in the range of 1 -2 μm, clearly shows that the sensitivity at 11° is higher than those at higher angles including 90°.
Particle Size Dependency of the Scatter Signal at different Angles
Measurements with polystyrene beads of defined sizes show that the measurement at 11° is more sensitive than measurements at 90°. This effect becomes even more evident when measuring relatively big particles in the size range of cells (Fig. 4). When measuring colloids with a size below 0.2 μm the measurement at 11° does not have any advantage over the 90° measurement. However, when particles of bigger sizes have to be detected, a measurement at 11° is far more sensitive.
Turbidity Measurements based on Scatter and Absorption
While the 11° scatter measurement is very sensitive to low turbidity values, the signal is saturated and even reversed at medium turbidity values due to multiple scattering events. The absorption signal at 0° however, which is relatively insensitive to low turbidity values, shows a linear response up to high concentrations (Fig. 5). Connecting the two approaches in one sensor leads to a combination of high sensitivity with a wide dynamic range.
Measuring Turbidity by Absorption – Path Length and Optics
The technically simpler 0° absorption approach allows measurements at mid to high turbidity levels, well beyond the range of scatter signal measurements. Unlike in a scatter measurement, the optical path length can be optimized to the expected or desired turbidity range using different sensor bodies, including very short path lengths if high turbidity values need to be monitored. When performing absorption measurements where the intensity of the light that reaches the detector should be decreasing with increasing turbidity, scatter events outside of the detector optics lead to an adverse effect (Fig 6). The scattered light detected by the absorption optics affects the linearity of the absorption signal. Depending on the application, the optical setup of the absorption measurement can either be tuned to a maximum measurement range using standard optics or to maximum linearity and sensitivity using focused performance optics (Fig. 7). Figure 8 shows the advantage in sensitivity and linearity of the performance over the standard optics. A positive side benefit of the performance optics is a reduced inter-sensor variability and thus better comparability required for redundant measurements.
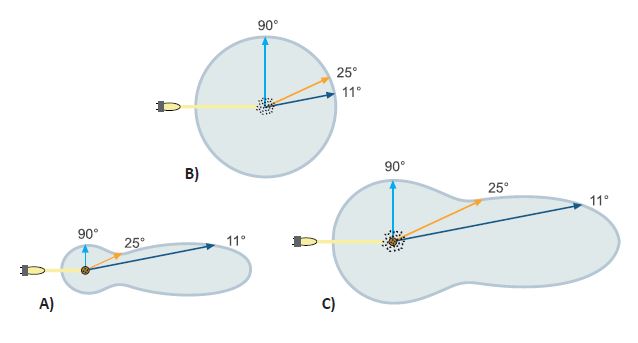
Figure 1: Angular intensity distribution of scattered light caused by
- A) bigger particles
- B) colloids and
- C) a mixture of both
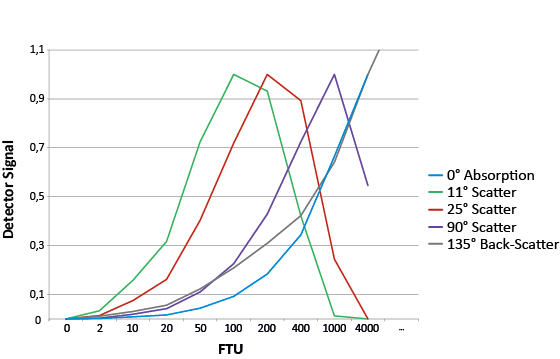
Figure 2: Signal obtained from different measurement angles using formazin. With the exception of the backscatter signal having its maximum at higher turbidity values, all signals are normalized.
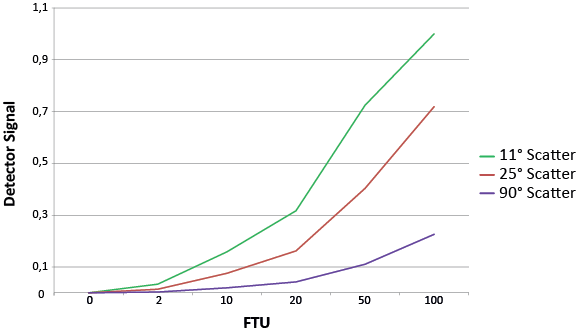
Figure 3: Scatter signal from three different detection angles using formazin.
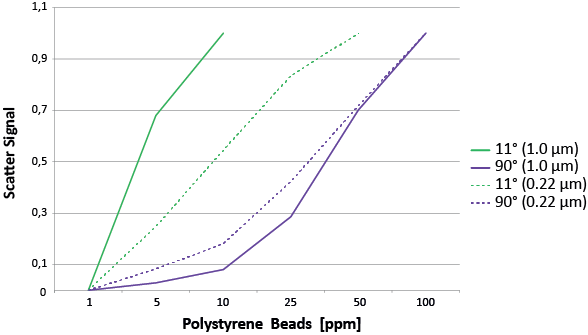
Figure 4: Scatter signal from 11° and 90° using polystyrene beads of two different sizes.
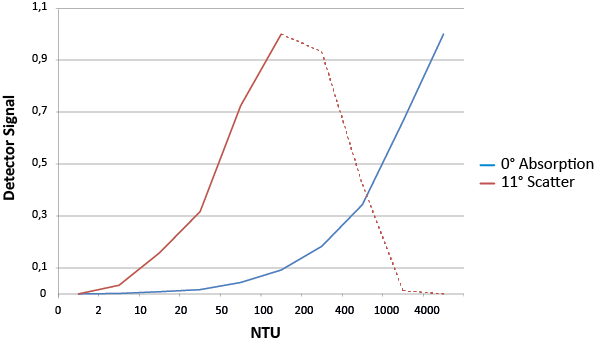
Figure 5: Signal response from 11° scatter and 0° absorption
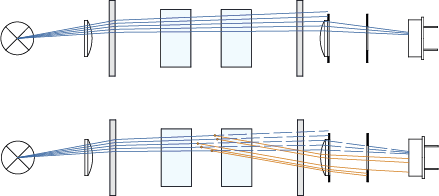
Figure 6: Effect of scatter in standard optics
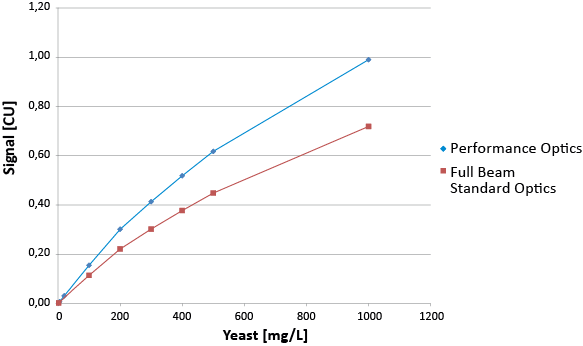
Figure 8: Measuring the concentration of yeast cells with two different optics.
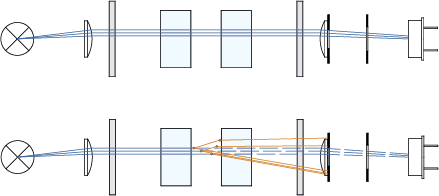
Figure 7: Reduced effect of scatter in focused optics
| Turbitity Unit | Abbreviation | Light source / Wavelength | Measurement Principle | Measurement Angle | Related Norm | |
|---|---|---|---|---|---|---|
| Water | Formazin Turbidity Unit | FTU | Not Defined | Not Defined | Not Defined | N/A |
| Nephelometric Turbidity Unit | NTU | white light, tungsten lamp | Scatter / Transmission Ratio | 90° | EPA Method 180.1. | |
| Formazin Nephelometric Unit | FNU | NIR | Scatter / Transmission Ratio | 90°± 1.5° | DIN EN 27027 / ISO 7027 | |
| Formazin Attenuation Unit | FAU | NIR | Absorption | 0°± 1.5° | DIN EN 27027 / ISO 7027 | |
| Beer | American Society of Brewing Chemists | ASBC | 580 nm | Scatter / Transmission Ratio | Not Defined | ASBC Beer-27B |
| European Brewery Convention | EBC (Stability Measurement) | Recommended: 650 nm ± 30 nm | Scatter / Transmission Ratio | 90° | MEBAK, EBC | |
| European Brewery Convention | EBC (Filter Control) | Recommended: 650 nm ± 30 nm | Scatter / Transmission Ratio | Forward Scatter | MEBAK, EBC |
1 FNU = 1 FTU = 1 NTU = 1 FAU = 0.25 EBC = 17.5 ASBC
valid only for formazin
 |
 |
 |
 |
|
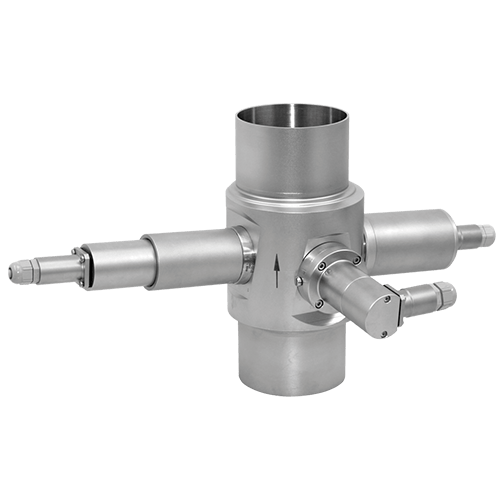
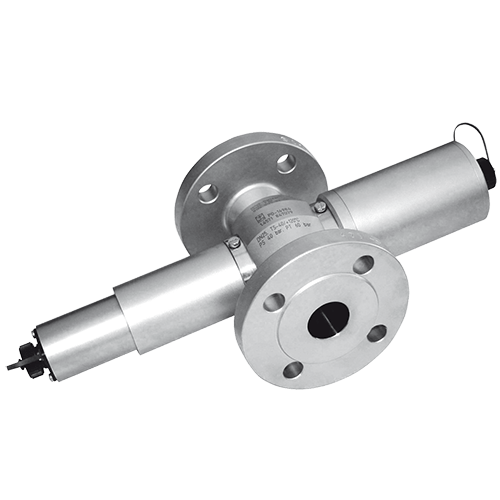
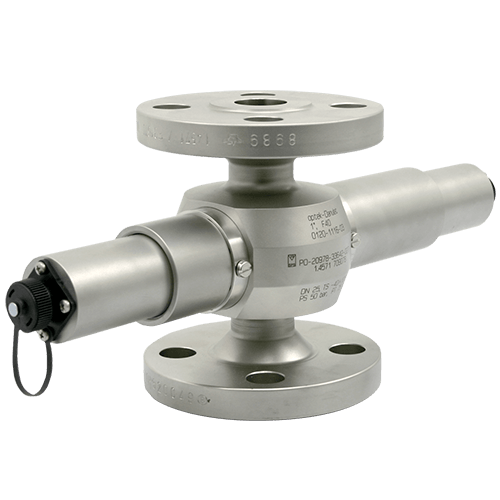
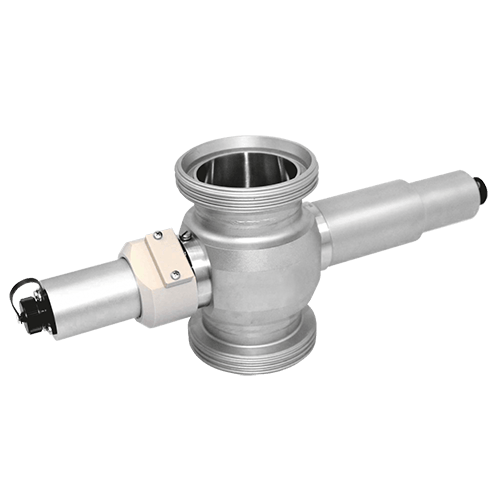
| Sensor | DTF16 | TF16-N | AF16-N | AF16-VB-P |
|---|---|---|---|---|
| Measurement Principle |
|
|
|
|
| Measurement Wavelength | 590 nm – 1100 nm | 730 nm – 970 nm | 730 nm – 970 nm | 730 nm – 970 nm |
| Detectors |
|
|
|
|
| Measuring Range |
|
Any Range between
|
Any Range between
|
Any Range between
|
| Calibration Adapter - VB | N/A | N/A | Optional | Included |
| Application Examples |
|
|
|
|
Data given are subject to changes without prior notice.
References:
[1] Brumberger, et al, Light Scattering, Science and Technology, November, 1968
[2] T. M. Morris, The relationship between haze and the size of particles in beer, J. Inst. rew., January-February, 1987, Vol. 93, pp. 13-17
Get in Touch with optek

- Germany
- +49-(0)201-63409-0
- United States
- +1-262-437-3600
- Singapore
- +65-6562-8292
- China
- +86-21-28986326