Introduction – what the sky tells us about light
Sunlight appears slightly yellow in the morning, ideally a blue sky at noon and turning into a lovely red at sunset. This describes perfectly the spectral distribution of light, because light consists of several colors with different wavelengths. Particles and molecules in the atmosphere scatter light depending on their size. Larger particles like water droplets or ice crystals reflect the light and appear white. Smaller particles produce stray light and e.g., the color blue with a short wavelength is scattered more than red light. That is why the sky appears blue at noon, but turns into red (longer wavelength for the longer way of the light) at sunset.
With that said, the spectral behaviour of light can be perfectly used to identify colors and particles. That is what optek sensors do. The light beam of a defined light source passes through a sample and detectors measure the passing light, e.g., directly at 0° or scattered light at angles of e.g., 11° or 90°. The result is always the light intensity passing through a sample. With a system calibration, using defined standards (e.g., optical filters or turbidity standards), this result can be used for qualitative and quantitative analysis. The measurement technique used and the selected wavelengths make the different analysis methods.
Lambert-Beer’s Law
A monochromatic light source, e.g., UV/VIS with the intensity I0 passes a diluted solution of a specific chemical substance of the thickness d and results in an intensity I. The light that passes through the solution gives the
which exponentially decreases with increasing concentration (c) of the solution and with the thickness (d) of the cuvette:

After rearrangement we get the "Lambert-Beer‘s-Law":
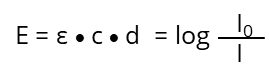
- Io: Intensity of the light beam before the solution
- I : Intensity of the light beam after passing the solution with thickness d
- d : thickness d, or optical beam path (cm)
- c : concentration of the absorbing substance in mol l-1
- ε : molar extinction coefficient at specific wavelength for this substance in l mol-1 cm-1
- E : extinction
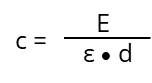
In the ideal case (ε) is under controlled measurement conditions (temperature, solvent, pH and so on.) depending on the absorbing substance and the wavelength (λ). It is a constant and not influenced by (c), listed in various tables for lots of chemicals. If the optical path length (d) and the chemical substance is known (so is ε) the unknown concentration (c) of a substance can be determined by measuring the extinction (E) at a specific wavelength:
The following figures (1 and 2) visualize the two effects on the Lambert-Beer’s Law:
Figure 1: Effects on the light transmission, based on sample concentration
Figure 2: Effects on the light transmission, based on optical path length
What is detected when light passes through a sample?
In general, two main results can be obtained: the value for absorbed or for transmitted light.
The light absorption, when passing through a sample, depends mainly on the composition / structure of the sample and the frequency of the light (wavelength). Following Lambert-Beer’s Law the intensity of the light passing through the sample is proportional to absorption coefficient and the optical path length (thickness of the sample).
If the sample is absorbing most of the light, the accuracy of detecting traces of chemicals is getting worse, because the absorption curve is more flat and small changes cannot be detected reliably. In this case a dilution of the sample or a smaller optical path length (thickness of the sample) can help getting to higher absorption values and more accurate results.
At the other end of the absorption scale, too much light passing through the sample can also cause unreliable results. Then a bigger optical path (thickness) can help to reduce the absorption to lower levels, where the detector can better handle the amount of light.
Figure 3: correlation between absorption (extinction) and transmission of light

Figure 4: part of the spectra of electro-magnetic waves.
The energy of the light source can be characterized by the wavelength. The smaller the wavelength the more energy comes with the electro-magnetic waves into the sample and either excites electrons to higher energy levels, or forces parts of the molecule to swing and bend. The optical sensors of optek use the wavelength ranges of UV or VIS or NIR in various configurations, for optimum performance in optical measurements.
Spectrum of a sample in UV-VIS range
When a sample with chemical substances is placed into a light source of the energy e.g., of 200 to 700 nm wavelength, the molecules absorb certain light at specific wavelengths. As shown above this kind of spectrum can be the result. It depends on the characteristic of the chemical substance to identify a wavelength area, where shapes / peaks in the spectra can be used to analyze e.g., color, concentration, structural changes (e.g., by changes in pH) or turbidity. The detection of the light passing through the sample can be done in various directions. The most common technique is measuring the light transmission (or the reciprocal absorption). The angle of detection is 0°.
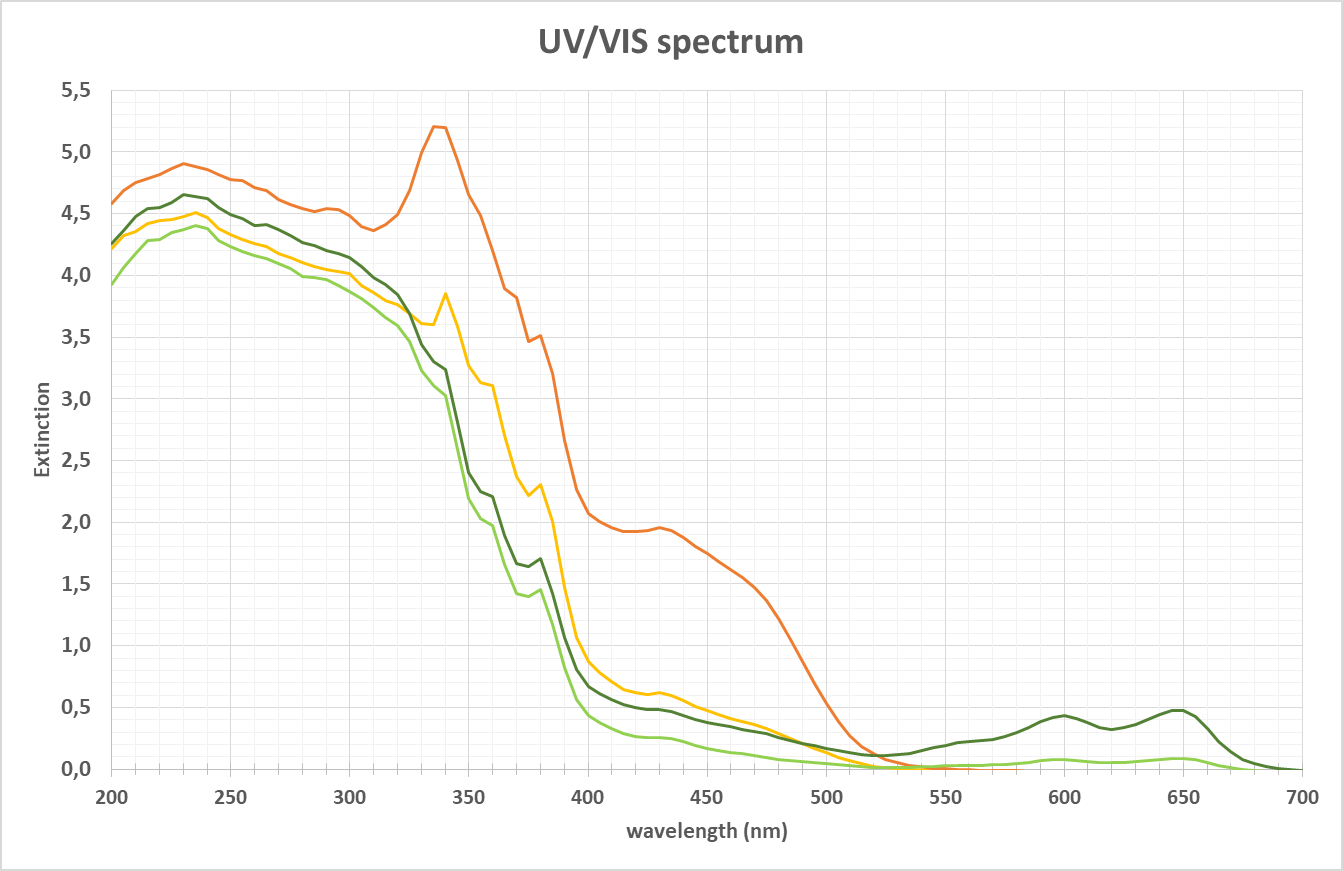
Figure 5: example of a typical UV-VIS spectrum.
As often used in biotech applications to characterize the pooling status of proteins, while the wavelength of 280 nm can be perfectly used for lower concentrations, the peak will easily exceed the maximum CU (concentration unit) and any peak structure is lost. Here at the flange of the main peak at e.g., > 300 nm a measurement can be done, where higher concentrations still give structured peaks.
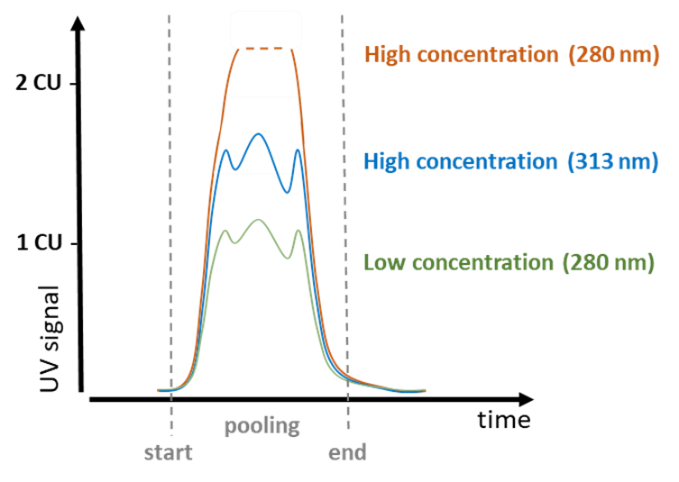
Figure 6: optek sensor AF46 to cover low and high protein concentrations with 2 wavelengths.
Get in Touch with optek

- Germany
- +49-(0)201-63409-0
- United States
- +1-262-437-3600
- Singapore
- +65-6562-8292
- China
- +86-21-28986326