Introduction
Turbidity is an optical characteristic of a liquid or transparent solid sample, which in general describes the clarity or haziness of the sample. In the past human eyes “measured” the turbidity in comparison to visual turbidity scales or by “experience”. Today’s industrial measurement of clarity or haze is automated and reproducible wherever the measurement is performed – eliminating any human influence.
What is the cause for turbidity?
If two liquids are combined, which usually do not mix with each other e.g., fat and water (like milk), creating a mixture of tiny little droplets, this is called an emulsion. If a solid of very little particles is mixed in a liquid, e.g., water, where nothing is dissolved like a salt, this is called a suspension. However, this kind of mixture tends to separate into solids (precipitate) and liquids relatively quickly. If these suspended solids keep their distribution in the liquid, a constant turbidity can be measured. See Figure 10 for a comparison of clear and natural apple juice.
How is color eliminated from turbidity?
Many samples are turbid and colored. The more intensive the color is, the more light is absorbed and the turbidity appears to be higher than it is. That is why the real turbidity is measured as scattered light, e.g. at an angle at 90° where just particles scatter the light beam, without any influence of coloration. In relation to the general light reduction (0°) by intensive colors, the final turbidity (scattered light) can exactly be determined.
Definition of Turbidity
In general, there are two norms describing the method of measuring turbidity:
- EPA Method 180.1: white light (400 – 680 nm)
- DIN EN ISO 27027: infrared light (780 – 900 nm), typically 860 nm
Both norms describe the method of turbidity measurement at 90° light scatter (Nephelometry). Finally the optical path length, the particle concentration and the particle size have a direct influence on the turbidity measurement result. In addition, a flowing sample shows a different turbidity than a resting sample. Turbulences within a sample stream cause tiny air bubbles inside the sample, which increases the turbidity as well.
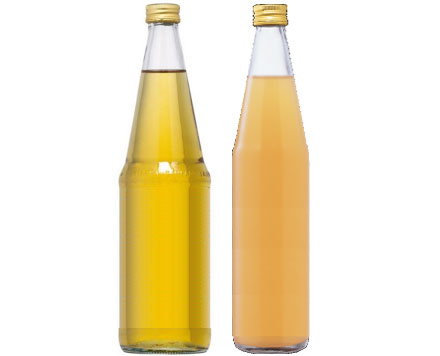
Figure 10: differences between clear and natural apple juice
Depending on the particle size the scattered light distribution can be different:
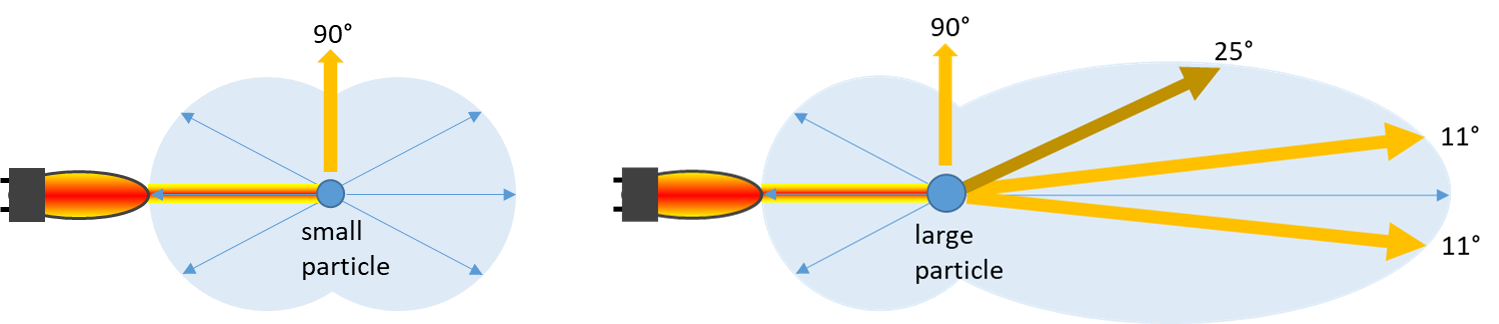
Figure 1 & 2: influence of the particle size on the light scatter distribution
Therefore, specific turbidity measuring devices have additional detection angles, e.g., 11-30°, to better cover the specific needs of small and large particles. Many years of experience at optek-Danulat GmbH have shown that instead of using a 25° angle for forward light scattering detection, the angle of 11° has advantages over 25° to better measure large particles.
Turbidity calibration
The calibration of turbidity sensors and laboratory meters is defined in the norms above, using e.g., Formazin standard solutions covering the turbidity range of interest. While EPA describes NTU (Nephelometric turbidity units), the ISO norm uses FNU (Formazin Nephelometric units) and FTU (Formazin turbidity units). The light passing through the sample is given as FAU (Formazin attenuation units). The standard Formazin results from a chemical reaction between hexamethylenetetramine and hydrazine sulfate:
Figure 4: series of turbidity standards based on Formazin

Figure 3: principle structure of Formazin.
Example for turbidity process control
In order to control the function of a filter section in the process of apple juice production, the sensor TF16-N can be used. In the NIR wavelength range 730 to 970 nm the sensor measured the total absorption value. As shown in the graph below the clear apple juice can easily be differentiated from the turbid raw juice. In case of a filter damage, the increased absorption value directly indicates a problem in the filter process. Immediate corrective action is possible.
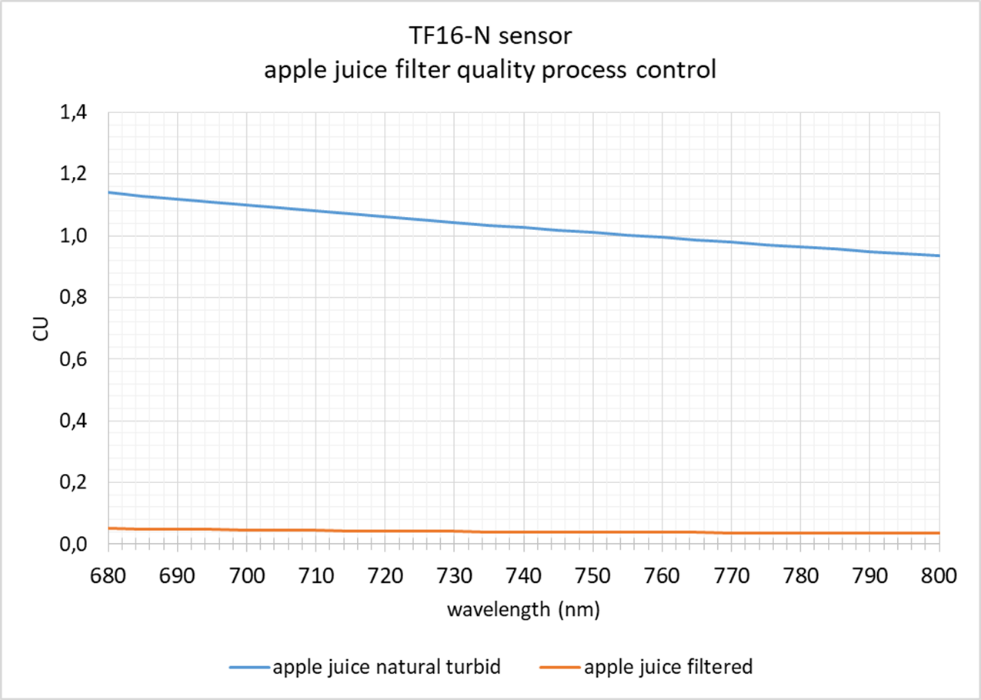
Figure 5: turbidity as an example for process control – here the filtering process.
Measuring Scatter – Angular Dependence
Turbidity measurements using a detection angle of 90° (side scatter) are most sensitive to particles in the size range of 0.1-0.5 μm e.g., colloids, which is why this approach is commonly used and described for quality measurements in beer and drinking water.
For measurements of particles in the range of 0.5 - 5 μm however, lower angles, measuring the intensive forward scatter caused by bigger particles, are more appropriate. Theoretically the highest signal to background ratio or highest sensitivity is obtained when measuring as close to 0° as possible. Due to technical limitations given by the need for separating the scatter- from the transmission signal of the excitation beam, the lowest angle that can be realized is 11°. At lower angles the scatter detectors would simply detect the direct light from the excitation beam.
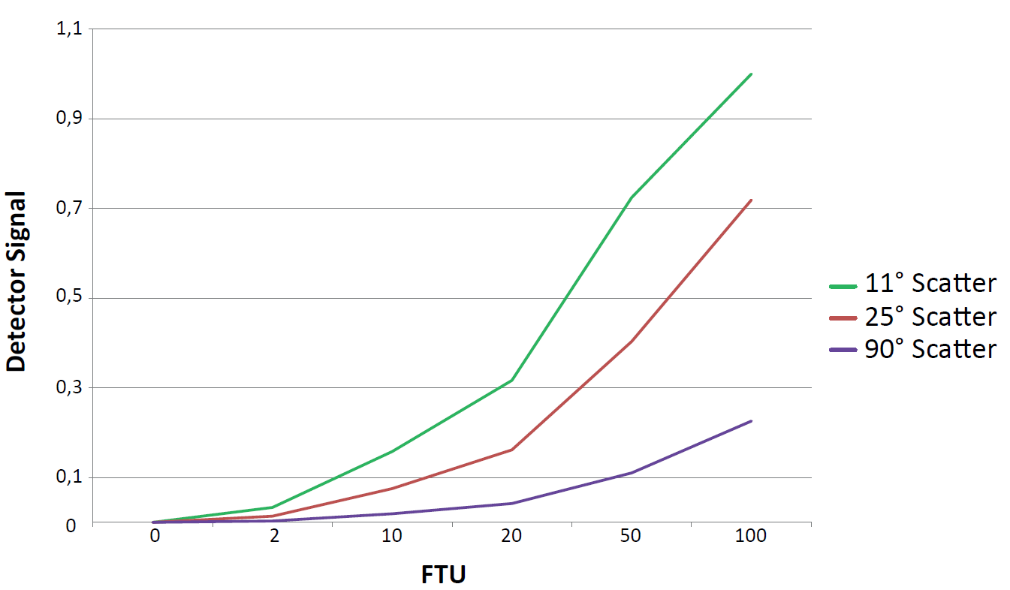
Figure 6: representing measurements using formazin, a common turbidity standard with a particle size distribution in the range of 1 -2 μm, clearly shows that the sensitivity at 11° is higher than those at higher angles including 90°.
Particle Size Dependency of the Scatter Signal at different Angles
Measurements with polystyrene beads of defined sizes show that the measurement at 11° is more sensitive than a measurement at 90°. This effect becomes even more evident when measuring relatively big particles in the size range of cells (Graphics 7). When measuring colloids with a size below 0.2 μm the measurement at 11° does not have any advantage over the 90° measurement. However, when particles of bigger sizes have to be detected, a measurement at 11° is far more sensitive.
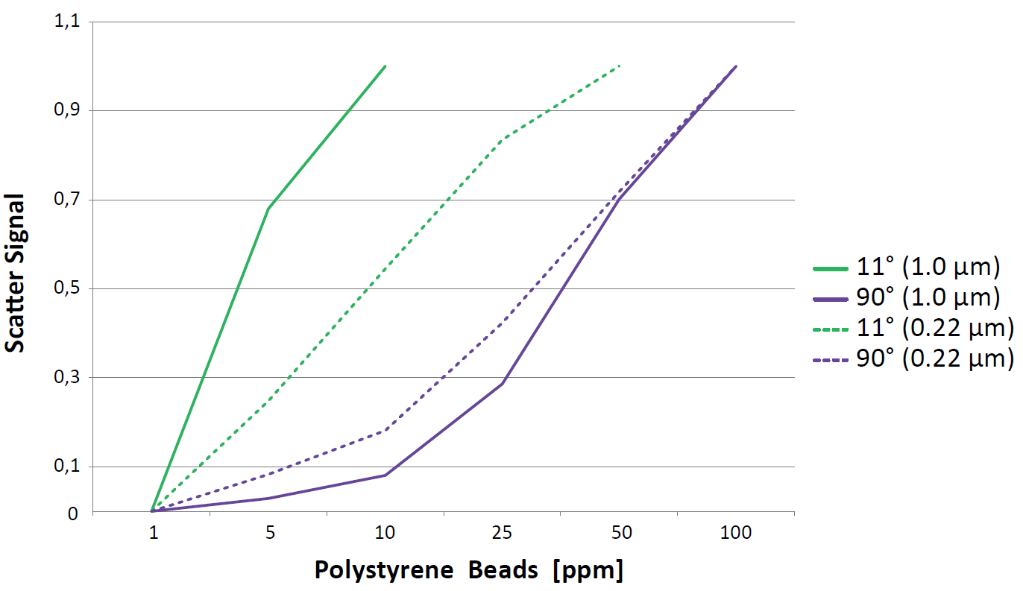
Figure 7: Scatter signal from 11° and 90° using polystyrene beads of two different sizes.
Turbidity Measurements based on Scatter and Absorption
While the 11° scatter measurement is very sensitive to low turbidity values, the signal is saturated and even reversed at medium turbidity values due to multiple scattering events. The absorption signal at 0° however, which is relatively insensitive to low turbidity values, shows a linear response up to high concentrations (Figure 8). Connecting the two approaches in one sensor leads to a combination of high sensitivity with a wide dynamic range.
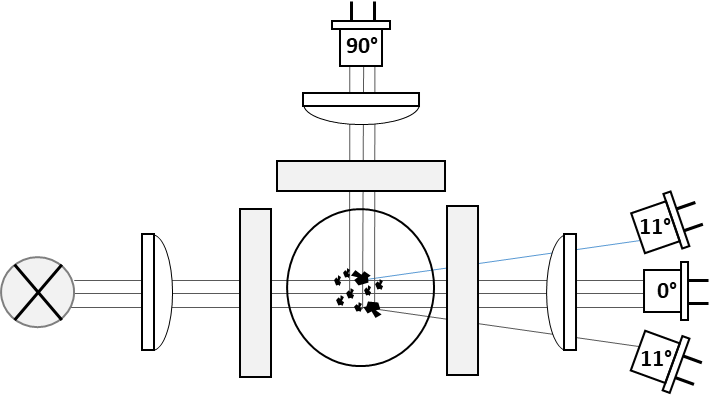
Figure 9: Turbidity / Nephelometry Optics with detectors for small and large particles
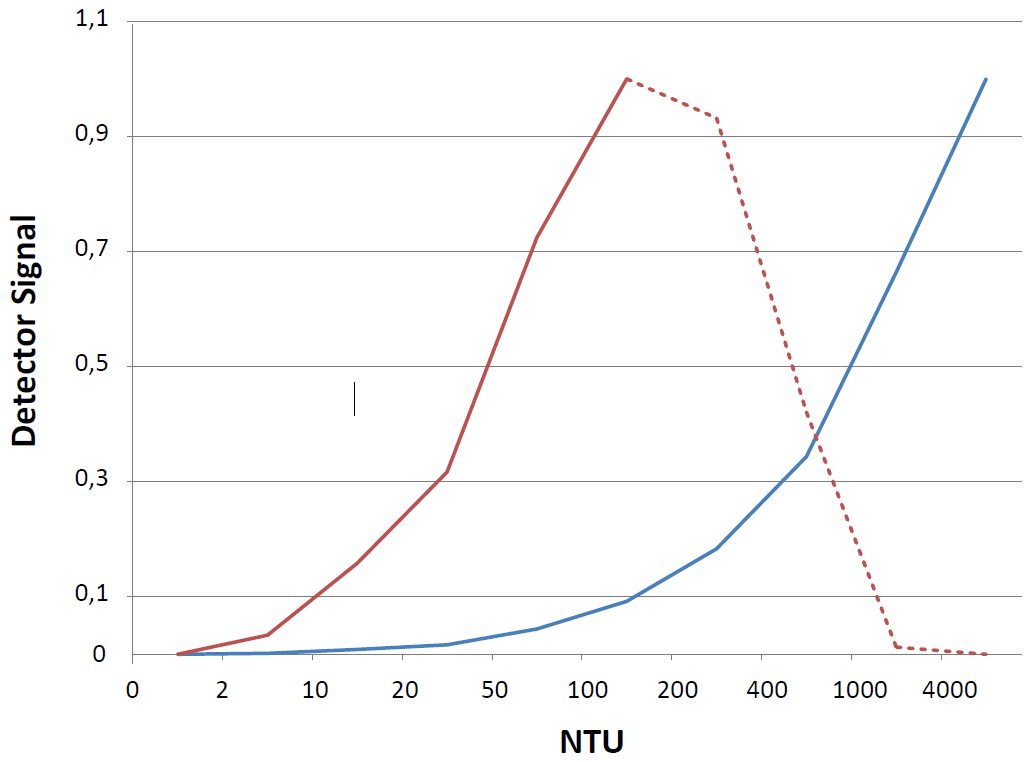
Figure 8: Signal response from 11° scatter and 0° absorption
Get in Touch with optek

- Germany
- +49-(0)201-63409-0
- United States
- +1-262-437-3600
- Singapore
- +65-6562-8292
- China
- +86-21-28986326